Image Details
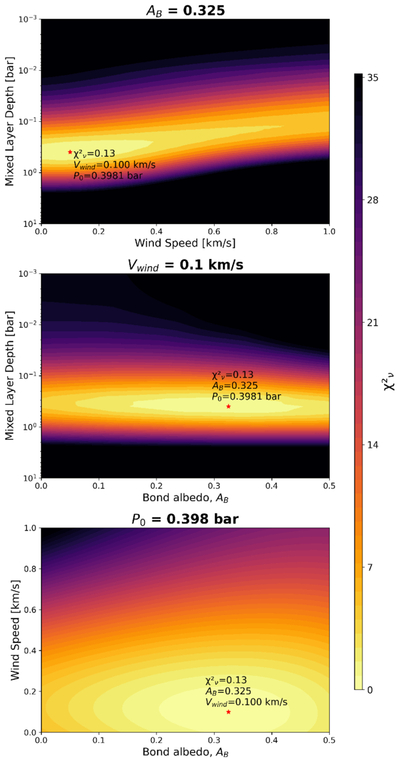
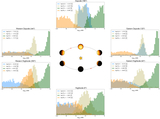
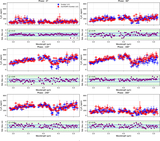
Caption: Figure 7.
χ2 contour plots showing slices of the parameter space from fitting the NIRSpec effective temperature observations at 20 orbital phases (left panel of Figure C1) to the Bell_EBM grid. The red stars are the locations of the best-fit model with reduced χ2 = 0.13. Each panel shows a 2D slice of the 3D parameter space, holding one parameter fixed at its best-fit value. This analysis predicts best-fit values of AB = 0.325, vwind = 0.1 km s−1, and P0 = 0.398 bar. The best-fit Bond albedo is similar to that inferred from the dayside and nightside temperatures.
Other Images in This Article
Show More
Copyright and Terms & Conditions
© 2026. The Author(s). Published by the American Astronomical Society.
Copyright ©
2026 Astronomy Image Explorer. All Rights Reserved.