Image Details
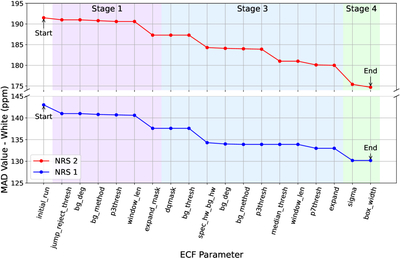
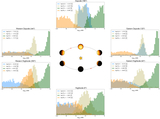
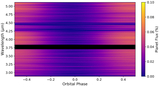
Caption: Figure A1.
Optimization histories for the step-wise data reductions performed with the Eureka! pipeline. Each point shows the resulting MAD of the NRS1 and NRS2 white light curves after varying a single reduction parameter relative to the initial run. Shaded regions delineate the portions of the optimization corresponding to Eureka! Stages 1, 3, and 4, illustrating how performance evolves across the pipeline. These comparisons show how targeted adjustments at each stage of the reduction pipeline progressively reduce the scatter in both NRS1 and NRS2.
Other Images in This Article
Show More
Copyright and Terms & Conditions
© 2026. The Author(s). Published by the American Astronomical Society.
Copyright ©
2026 Astronomy Image Explorer. All Rights Reserved.