Image Details
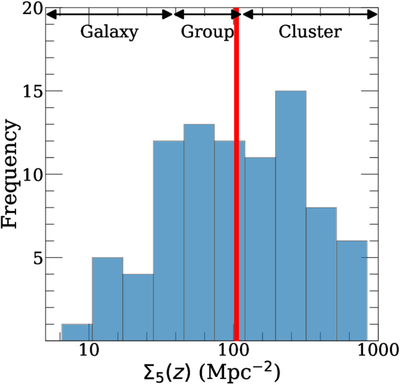
Caption: Figure 8.
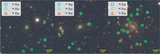
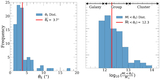
Σ5(z) distribution for 87 lenses. The red line denotes the mean Σ5(z) for our sample (104.9 Mpc−2; which corresponds to a large group). Our distribution shows that AGEL survey deflectors are dominated by group and cluster halos. We include galaxy-scale deflector environments, which have upper limit measurements on Σ5(z) (see Section 3.2.1).
Other Images in This Article
Show More
Copyright and Terms & Conditions
© 2026. The Author(s). Published by the American Astronomical Society.
Copyright ©
2026 Astronomy Image Explorer. All Rights Reserved.