Image Details
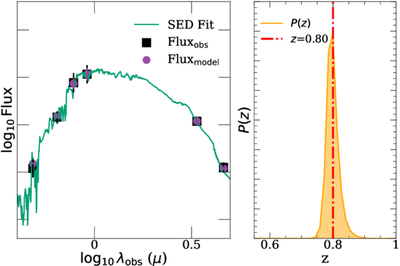
Caption: Figure 2.
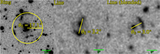
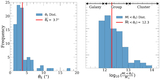
EAZY output for a line-of-sight object in the field of AGEL2303, with fitted redshift zphot = 0.80. Left: ﹩{\mathrm{log}}_{10}﹩ flux versus ﹩{\mathrm{log}}_{10}﹩ observed wavelength. The black squares are the observed fluxes in six bands, and the magenta circles are the modeled flux measurements; the green distribution is the SED fit. The posterior SED shows continuum features, consistent with an early-type galaxy. Right: the posterior redshift probability distribution, P(z), against z.
Other Images in This Article
Show More
Copyright and Terms & Conditions
© 2026. The Author(s). Published by the American Astronomical Society.
Copyright ©
2026 Astronomy Image Explorer. All Rights Reserved.