Image Details
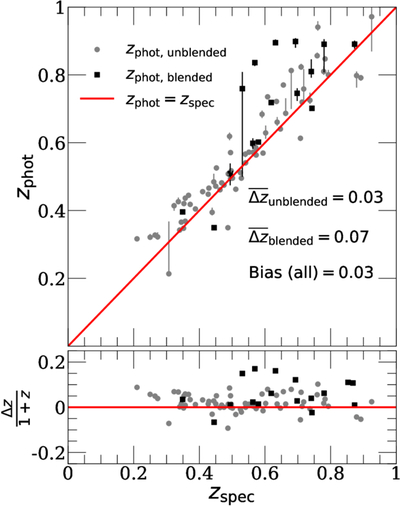
Caption: Figure 3.
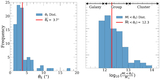
zphot versus zspec plot for a sample of 83 central deflectors with measured zphot. Black triangles are deflectors whose SED fits showed blending of photometry with the source, and gray circles are deflectors without obvious signs of blending. Error bars are the 16th and 84th percentile values in the P(z) outputs. For unblended systems, we measure ﹩\frac{{\rm{\Delta }}z}{1+{z}_{\,\rm{spec}\,}}﹩ = 0.032, demonstrating that zphot measurements accurately reproduce deflector redshifts for most AGEL systems. We observe a bias of 0.03 for these fits. For blended systems, we measure ﹩\frac{{\rm{\Delta }}z}{1+{z}_{\,\rm{spec}\,}}﹩ of 0.07. The bias in our unblended deflectors is due to zphot overestimates of early-type galaxies (F. B. Abdalla et al. 2011); in our blended deflectors, it is due to source light bleeding into deflector photometry.
Other Images in This Article
Show More
Copyright and Terms & Conditions
© 2026. The Author(s). Published by the American Astronomical Society.