Image Details
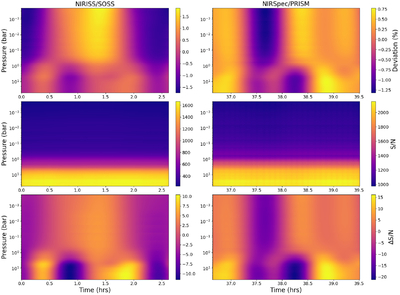
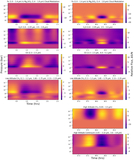
Caption: Figure 5.
NIRISS/SOSS (left) and NIRSpec/PRISM (right) vertical variability maps for SIMP J0136. Top row: composite maps including variation in the percentage deviation across all observed wavelengths. Middle row: S/N vertical map. Pressure levels ≳ 1 bar have the highest S/N corresponding to higher observational S/N in wavelengths ≲ 1.8 μm. Bottom row: S/N-weighted composite variability maps. Stratification into ≳2 interacting layers can be observed. As the rotational period is ∼2.4 hr, longitudinal wrapping can be observed within each observation. Visually, atmospheric evolution can be seen over the ∼35 hr between observations.
Other Images in This Article
Copyright and Terms & Conditions
© 2026. The Author(s). Published by the American Astronomical Society.