Image Details
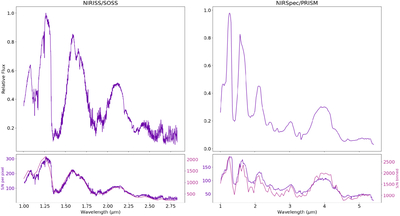
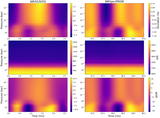
Caption: Figure 1.
NIRISS/SOSS (left) and NIRSpec/PRISM (right) spectra for SIMP J0136. Top row: time-averaged spectra normalized to maximum emission. Bottom row: per pixel (purple) and spectrally and temporally binned (magenta) S/N. The NIRISS/SOSS and NIRSpec/PRISM data were previously presented in R. Akhmetshyn et al. (2025) and A. M. McCarthy et al. (2025), and E. Nasedkin et al. (2025), respectively.
Other Images in This Article
Copyright and Terms & Conditions
© 2026. The Author(s). Published by the American Astronomical Society.
Copyright ©
2026 Astronomy Image Explorer. All Rights Reserved.