Image Details
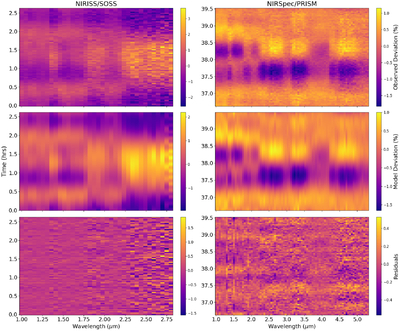
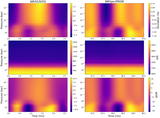
Caption: Figure 2.
NIRISS/SOSS (left) and NIRSpec/PRISM (right) variability maps (dynamics spectra) for SIMP J0136. Variability maps use 0.05 μm spectral binning and demonstrate the normalized spectral variability over the periods of observation. Integration times for each temporal bin are 118 s (NIRISS/SOSS) and 129 s (NIRSpec/PRISM). Top row: observed variability maps. Middle row: best-fit variability maps with lightcurves inferred using the harmonic model described in Section 3.1 and Bayesian nested sampling. Bottom row: residuals between the observed and best-fit variability maps. NIRISS/SOSS’s residuals (0.00% ± 0.215%) approximate white noise while the NIRSpec/PRISM residuals (0.00% ± 0.075%) contain seemingly structured harmonics signals of k ≳ 3, likely due to unmodeled dynamics or systematics. The NIRISS/SOSS and NIRSpec/PRISM data were previously presented in R. Akhmetshyn et al. (2025) and A. M. McCarthy et al. (2025), and E. Nasedkin et al. (2025), respectively.
Other Images in This Article
Copyright and Terms & Conditions
© 2026. The Author(s). Published by the American Astronomical Society.