Image Details
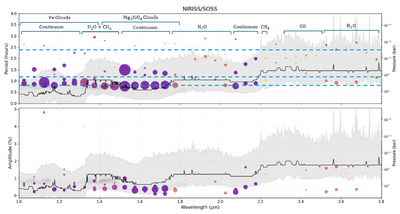
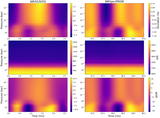
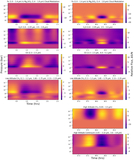
Caption: Figure 3.
NIRISS/SOSS comparison of retrieved harmonic periods and amplitudes as a function of wavelength. Each data point denotes an inferred harmonic mode with either two or three modes per wavelength (contingent on the best fit). The data point sizes are inverse to their relative uncertainties. As seen on the left y-axis: top row: period vs. wavelength. It can be seen that k = 3 (∼0.8 hr) harmonics correspond to the deepest pressure levels (≳1 bar). Bottom row: amplitude vs. wavelength. Color denotes the dominant spectral absorption feature in each bin: continuum (purple), H2O + CH4 (magenta), H2O (red), CO (orange), and CH4 (yellow). The teal, dashed horizontal lines denote 2.4 hr (k = 1), 1.2 hr (k = 2), and 0.8 hr (k = 3) periodicities. The black line corresponds to the maximum flux from the Sonora Bobcat (M. S. Marley et al. 2021) contribution function seen at each wavelength and the associated pressures as seen on the right y-axis. The gray shaded region represents 10−3 of the maximum contribution function flux.
Other Images in This Article
Copyright and Terms & Conditions
© 2026. The Author(s). Published by the American Astronomical Society.