Image Details
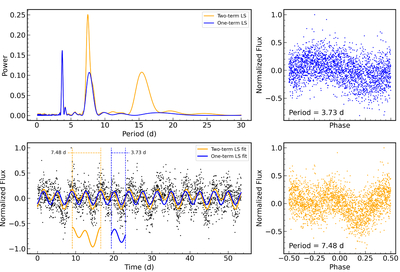
Caption: Figure 10.
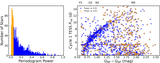
An example of a star for which using the two-term LS led to a period correction. The one- and two-term LS periodograms are shown at the top left. The corresponding best-fit LS models at the highest power period for each periodogram are plotted with the Cycle 5 light curve (bottom left). The location of the secondary peak in the one-term periodogram matches the location of the primary peak in the two-term periodogram (7.48 days). This corresponds to a Prot that is approximately double that measured using the location of the primary peak in the one-term periodogram (3.73 days). The original measurement at 3.73 days is a half-period harmonic of the true period, and was corrected to 7.48 days. The top-right panel shows the light curve phase-folded on the original Prot measurement, while the bottom-right panel shows the light curve phase-folded on the corrected measurement. The varying amplitude of the signal (i.e., the “double dipping” causing the harmonic measurement) is evident in the bottom-right phase-folded light curve, and is accurately modeled by the two-term periodogram.
Other Images in This Article
Show More
Copyright and Terms & Conditions
© 2026. The Author(s). Published by the American Astronomical Society.