Image Details
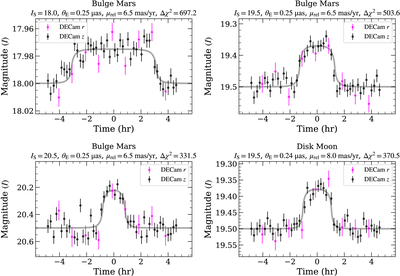
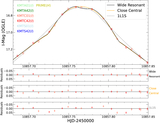
Caption: Figure 7.
Simulated FFP events as observed by DREAMS. For clarity, data within each observing block are binned (four points in z and three in r per block). Magnitudes are placed on the I-band scale. Lens and source for each panel parameters are summarized in Table 4. Δχ2 denotes the difference in χ2 between a flat model and the best-fit 1L1S model.
Other Images in This Article
Copyright and Terms & Conditions
© 2026. The Author(s). Published by the American Astronomical Society.
Copyright ©
2026 Astronomy Image Explorer. All Rights Reserved.