Image Details
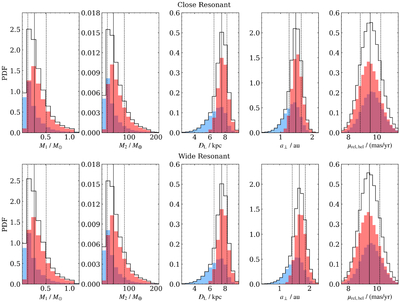
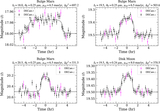
Caption: Figure 5.
Posterior probability distributions from our Bayesian analysis are shown for the host mass M1, the planetary mass M2, the lens distance DL, the projected planet-host separation a⊥, and the heliocentric lens-source relative proper motion μhel,rel. In each panel, the solid black curve indicates the median, and the two dashed black curves mark the 15.9% and 84.1% credible limits. Contributions from bulge and disk lens populations are shown in red and blue, respectively.
Other Images in This Article
Copyright and Terms & Conditions
© 2026. The Author(s). Published by the American Astronomical Society.
Copyright ©
2026 Astronomy Image Explorer. All Rights Reserved.