Image Details
Caption: Figure 1.
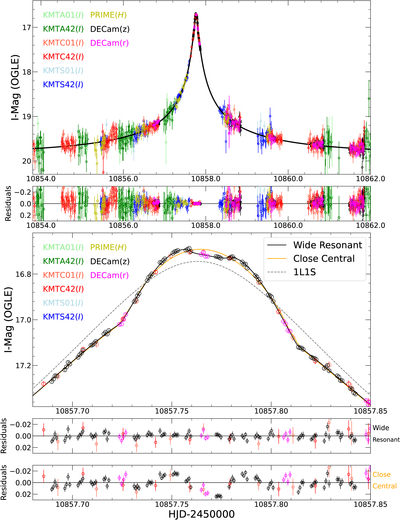
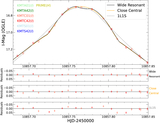
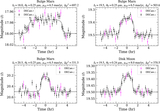
Light curve of the microlensing event, KMT-2025-BLG-1616, with the 2L1S models (solid black and orange lines) and the underlying 1L1S model (dashed gray line). Different datasets are plotted in different colors. The upper panels shows the 8 days data around the peak. The lower panels present a close-up of the planetary anomaly and the residuals relative to the 2L1S models.
Other Images in This Article
Copyright and Terms & Conditions
© 2026. The Author(s). Published by the American Astronomical Society.
Copyright ©
2026 Astronomy Image Explorer. All Rights Reserved.