Image Details
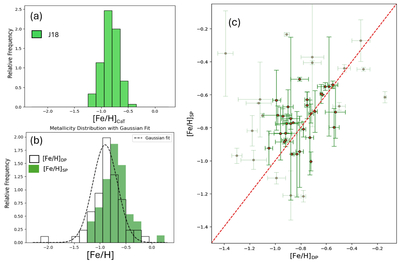
Caption: Figure 5.
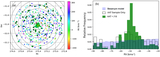
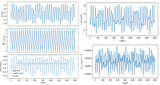
Comparisons between the calibration methods of obtaining [Fe/H] from the CaT lines (B. Dias & M. C. Parisi 2020, J18) with the SP_Ace code results. (a) A histogram of the J18 sample of 98/100 stars is shown in green, which were matched with BDBS photometry. For these 98 stars, using the luminosity correction in the i band, we find: [Fe/H]CaT = –0.84 ± 0.17 dex. (b) The 58 stars in the RV-selected sample (−25 > RV > − 65 km s−1) are shown as the black-line histogram (no fill), calibrated using B. Dias & M. C. Parisi (2020) method. For all objects: [Fe/H]DP = –0.91 ± 0.40 dex. Targets with 3500 < T(K) < 7500 were fitted with the SP_Ace code: [Fe/H]SP = –0.78 ± 0.20 dex. The dotted line is the Gaussian fit to the P23 data, presented in C. Crociati et al. (2023): [Fe/H]CaT = –0.90 ± 0.20 dex. (c) Comparing the two fits for the overlap between the samples (all stars are faint green and orange-filled circles). The red line is the 1:1 fit of the CaT method and the SP_Ace code, which fits the stars with both [Fe/H]DP and [Fe/H]SP which are limited to values between −0.5 and −1.1 dex (40 objects; brighter green and orange points).
Other Images in This Article
Copyright and Terms & Conditions
© 2026. The Author(s). Published by the American Astronomical Society.