Image Details
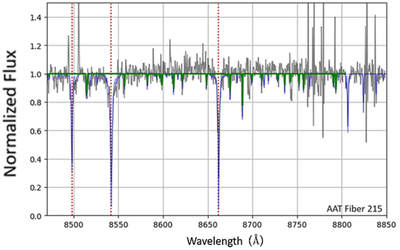
Caption: Figure 3.
An example spectrum is shown with the regions used for the spectral analysis process identified. This is an extracted, processed, and normalized spectrum for AAT/AAOmega fiber #215. The normalized spectrum is shown in gray. The centroid of each CaT feature is shown as a red dotted line, which has been shifted back to the rest frame. The specutils routine was used to find lines by the derivative method, and the results were averaged for the three CaT lines. The blue line is the standard RGB spectrum which best fits the target star using the SP_Ace code (C. Boeche & E. K. Grebel 2016; C. Boeche et al. 2021) and the green line is the fitted region, not using the CaT, and avoiding the sky-lines at longer wavelengths than 8800 Å. The results for this star are: [Fe/H]DP = –0.92 ± 0.09 dex, [Fe/H]SP = –0.83 ± 0.08 dex, and [α/Fe] = +0.27 ± 0.27 dex.
Other Images in This Article
Copyright and Terms & Conditions
© 2026. The Author(s). Published by the American Astronomical Society.