Image Details
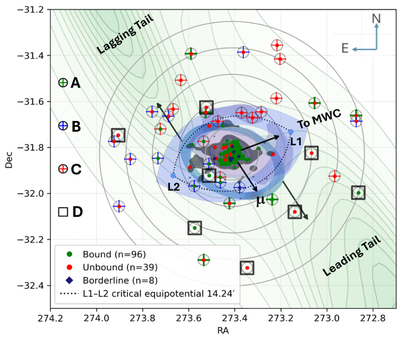
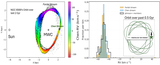
Caption: Figure 9.
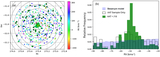
Observed AAT- and J18-datasets overlaid with GALA-generated mock-stream (Y. Chen et al. 2025). Concentric gray circles mark 1–5 × rt with ﹩{r}_{t}=6\mathop{.}\limits^{^{\prime} }9﹩ (S. Ortolani et al. 2001; E. Valenti et al. 2011). All AAT targets meeting the RV+metallicity cuts are shown as open circles, and are then filled with symbols identifying their properties. Symbol classes: A (7: large green pluses): −1.1 < [Fe/H] < –0.5 and [α/Fe] > + 0.2; B (12: blue pluses): same RV, [Fe/H] with [α/Fe] > + 0.1; C (13: red pluses): same RV, [Fe/H] with +0.1 > [α/Fe] > − 0.1 or CaT-only metallicities in range; D (8: open black squares): RV and [Fe/H] in range but possibly foreground (d < 10.5 kpc). The J18 and AAT spectroscopic targets, in and around NGC 6569, are classified as energetically (see Appendix) bound (green circles; n = 96), unbound (red circles; n = 39), and borderline (blue diamonds; n = 8). The dotted curve marks the reference critical equipotential surface at ﹩14\mathop{.}\limits^{^{\prime} }24﹩, which is the Jacobi (tidal) surface or the Jacobi contour (at EJ = Ecrit). Black arrows show the directions toward the Galactic Center (L1/L2 axis) and of the cluster proper motion μ. The Chen (rotating bar, star–particle density) tidal debris is shown as green contours and shading (RV+PM window), the P23 spectroscopic sample (gray shading), and the Gaia HB/RC selection (purple). The light-blue shading surrounding the black dotted line indicates the L1/L2 Jacobi boundary between ﹩1{1}^{{\prime} }﹩ and ﹩1{8}^{{\prime} }﹩ over the whole orbit. The darker, blue-shaded, ellipse band is the most probable escape zone for stars over the whole orbit—stars would peel away from the critical equipotential near its flanks, not along the L1/L2 axis.
Other Images in This Article
Copyright and Terms & Conditions
© 2026. The Author(s). Published by the American Astronomical Society.