Image Details
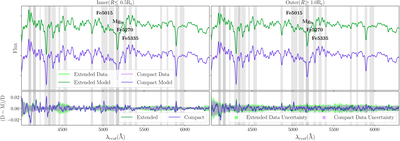
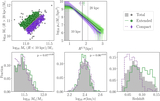
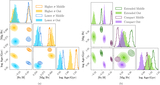
Caption: Figure 9.
Top row: continuum-extracted input data (lighter-colored lines) and the model spectra (darker-colored lines). Bottom row: relative residual = (data – model)/data and relative data uncertainty (3σ/data) shown in lines and shaded areas, respectively. The inner and outer spectra are shown in the left and right subplots, respectively. The extended subsample is in green, and the compact subsample is in purple. The Jupyter notebook for reproducing this figure can be found here: ✎. This repository is also available on Zenodo (https://doi.org/10.5281/zenodo.17979404).
Other Images in This Article
Show More
Copyright and Terms & Conditions
© 2026. The Author(s). Published by the American Astronomical Society.
Copyright ©
2026 Astronomy Image Explorer. All Rights Reserved.