Image Details
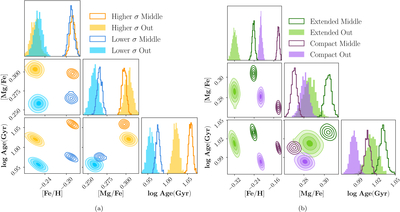
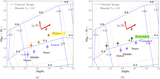
Caption: Figure 10.
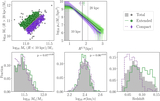
Corner plots of [Fe/H], [Mg/Fe], and stellar age (﹩{\rm{log}}\,{\rm{Age}}({\rm{Gyr}})﹩) from the alf fitting for the two-sample-split methods. We only show the middle (empty) and outer (filled) bins in the plots. The left figure shows the high-σ* (orange) vs. low-σ* (blue) subsamples. The right figure shows the extended (green) vs. compact (purple) subsamples. The Jupyter notebook for reproducing this figure can be found here: ✎. This repository is also available on Zenodo (https://doi.org/10.5281/zenodo.17979404).
Other Images in This Article
Show More
Copyright and Terms & Conditions
© 2026. The Author(s). Published by the American Astronomical Society.
Copyright ©
2026 Astronomy Image Explorer. All Rights Reserved.