Image Details
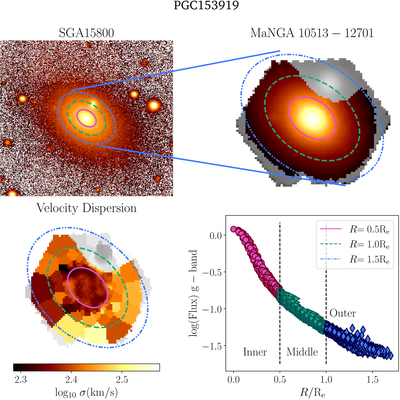
Caption: Figure 2.
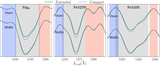
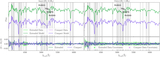
Example galaxy (PGC 153919) in the final sample. Top left: SGA g-band image. The title is the SGA id of this galaxy. Top right: MaNGA g-band flux map with its plate-ifu as the title. The gray region represents the original data, and the colored pixels are the ones used in the stacking after the S/N cut and multisource masking. Bottom left: Voronoi-binned stellar velocity dispersion map available in MaNGA DAP maps. Similarly, the gray color map covers the entire data cube, while the colored region represents the selected region. The similar ellipses in these three plots, shown in blue dashed–dotted–dotted, green dashed, and pink solid ellipses, have semimajor axes of 0.5 Re, 1.0 Re, and 1.5 Re, respectively. Bottom right: radial profile of the g-band flux in MaNGA data. We can see that the additional masking results in a smoother profile, implying that our masks have successfully excluded contamination from other sources. The pink circles, green triangles, and blue diamonds stand for pixels with major axis ranges in inner (R ≤ 0.5Re), middle (0.5Re ≤ R ≤ 1.0Re), and outer (R ≥ 1.0Re) radii, respectively.
Other Images in This Article
Show More
Copyright and Terms & Conditions
© 2026. The Author(s). Published by the American Astronomical Society.