Image Details
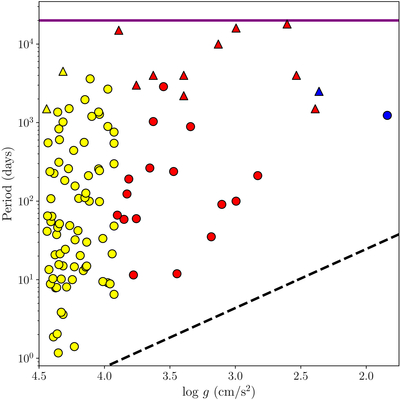
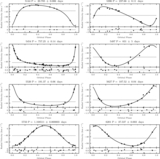
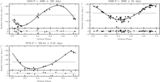
Caption: Figure 8.
The distribution of orbital period against primary-star ﹩{\mathrm{log}}g﹩ for binary stars with orbital solutions. The yellow markers represent main-sequence binaries, the red markers represent subgiant and red giant binaries, and the blue markers represent asymptotic giant binaries. Circles represent binaries that have an orbital solution whereas we use triangles to indicate a lower limit on period for the binaries that do not have an orbital solution but show long-term RV trends of at least that many days. We also show the maximum period for which WOCS is sensitive to detecting RV variability (Section 5.1) with the purple solid line. Finally, the black dashed line shows the Roche lobe radius as a function of orbit period for equal mass binaries.
Other Images in This Article
Show More
Copyright and Terms & Conditions
© 2026. The Author(s). Published by the American Astronomical Society.