Image Details
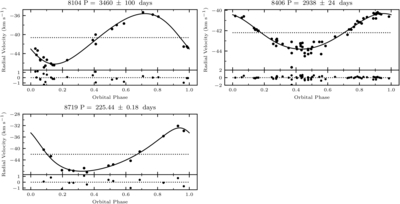
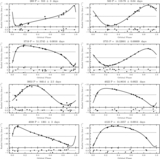
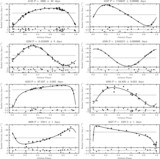
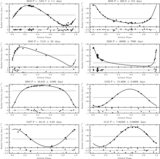
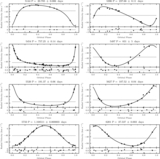
Caption: Figure 5.
NGC 188 SB 1 orbit plots. For each binary in Table 6, we plot RV against orbital phase, showing the data points with black dots and the orbital fit to the data with the solid line; the dotted line marks the γ-velocity. Beneath each orbit plot, we show the residuals from the fit. Above each plot, we give the binary ID and orbital period.
Other Images in This Article
Show More
Copyright and Terms & Conditions
© 2026. The Author(s). Published by the American Astronomical Society.
Copyright ©
2026 Astronomy Image Explorer. All Rights Reserved.