Image Details
Caption: Figure 4.
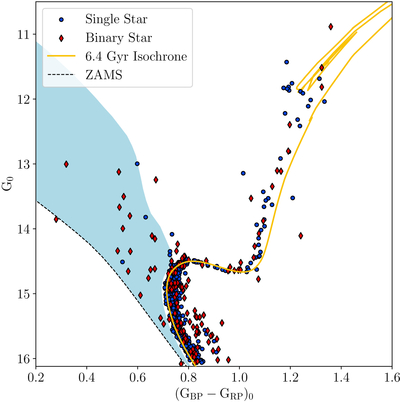
The color–magnitude diagram of member stars of NGC 188. Single stars are plotted as blue circles and binary stars are plotted as red diamonds. Stars have been differentially dereddened using the SFD dustmap along with an additional correction of E(GBP − GRP) = 0.0089 from our isochrone fit. The zero-age main sequence is plotted as a dashed line. Our best-fit MIST isochrone of 6.4 Gyr, [Fe/H] = −0.024 is shown as a solid line. The BSS region of NGC 188 is shaded in light blue. The upper bound is the terminal-age main sequence.
Other Images in This Article
Show More
Copyright and Terms & Conditions
© 2026. The Author(s). Published by the American Astronomical Society.
Copyright ©
2026 Astronomy Image Explorer. All Rights Reserved.