Image Details
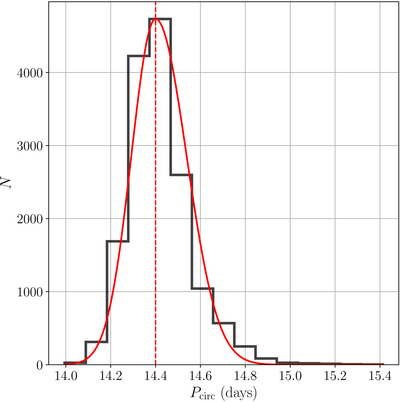
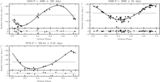
Caption: Figure 7.
Distribution of circularization periods (Pcirc) resulting from the MCMC analysis, fit with an asymmetric Gaussian function. The red curve shows a ﹩{P}_{{\rm{circ}}}=14.{4}_{-0.11}^{+0.14}﹩ days.
Other Images in This Article
Show More
Copyright and Terms & Conditions
© 2026. The Author(s). Published by the American Astronomical Society.
Copyright ©
2026 Astronomy Image Explorer. All Rights Reserved.