Image Details
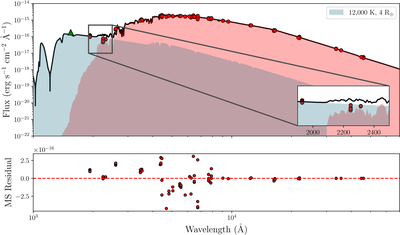
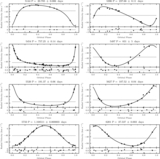
Caption: Figure 10.
We show the composite SED for WOCS 3953 (the error bars for each flux measurement are within their markers). The SED of the BL (5600 K) candidate is plotted with the red shaded region while the SED of the potential WD companion (12,000 K) is represented with the blue shaded region. The combined flux from the BL and WD companion is plotted with a black line. The green triangle represents the 3σ upper limit on a GALEX FUV flux measurement. The lower plot shows the residuals between the BL model spectrum and flux measurements.
Other Images in This Article
Show More
Copyright and Terms & Conditions
© 2026. The Author(s). Published by the American Astronomical Society.
Copyright ©
2026 Astronomy Image Explorer. All Rights Reserved.