Image Details
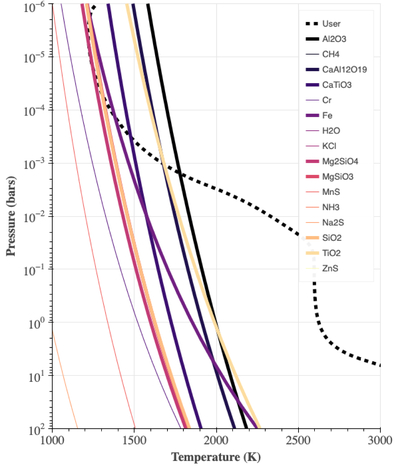
Caption: Figure 8.
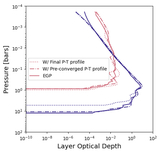
Default plot from Virga’s recommend gas function shown for the pressure–temperature profile published in D. Grant et al. (2023). The dashed curve represents the user-input P–T profile, while solid lines represent the condensation curves. The thick solid curves are mathematically what gases Virga would condense. We urge users to carefully consider what condensate to include in their model instead of choosing all those that mathematically condense.
Other Images in This Article
Copyright and Terms & Conditions
© 2026. The Author(s). Published by the American Astronomical Society.
Copyright ©
2026 Astronomy Image Explorer. All Rights Reserved.