Image Details
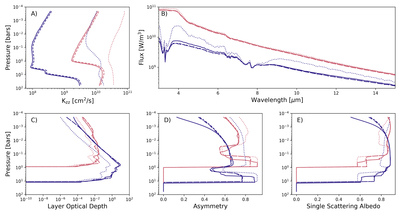
Caption: Figure 10.
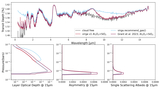
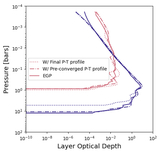
Here we demonstrate Virga’s ability to reproduce the Diamondback model grid’s cloud models, given the precomputed pressure–temperature profile. In panels (a)–(e), solid lines are data derived straight from Zenodo or Diamondback log files. In panel (a) we start by demonstrating the ability to reproduce the K zz profile used for Diamondback using the Virga function to compute K zz. Dashed lines show the profile derived from a convective heat flux profile taken from EGP, while dotted lines show the profile computed using an estimate for the convective heat flux (dotted line). Panels (c)–(e) show the Virga output using the corresponding K zz profiles from panel (a). Note that dotted–dashed lines show the optical properties derived when directly using the K zz profile from Diamondback (solid line K zz in panel (a)). Panel (b) shows all corresponding spectra alongside those published. Ultimately we can reproduce the Diamondback spectra when using self-consistent estimates for the convective heat flux.
Other Images in This Article
Copyright and Terms & Conditions
© 2026. The Author(s). Published by the American Astronomical Society.