Image Details
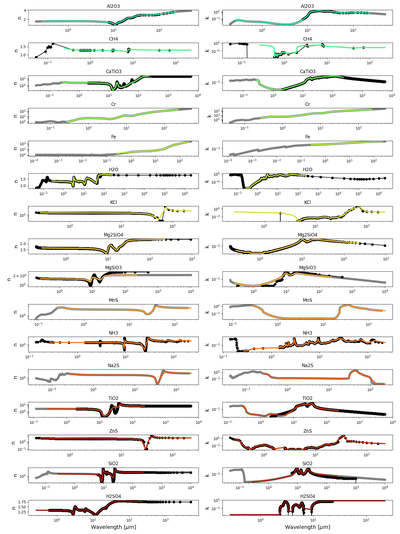
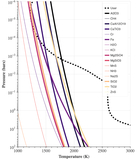
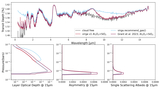
Caption: Figure 2.
Processed IOR for the condensates available in Virga. Gray lines represent data available through the HITRAN 2020 (I. Gordon et al. 2022) aerosol database. Black circles represent data available from the LX-MIE database (D. Kitzmann & K. Heng 2018). Colored lines represent the interpolated and processed IOR from which our Mie properties are computed. This figure can be fully reproduced and modified with new data using Virga’s IOR Factory (link here).
Other Images in This Article
Copyright and Terms & Conditions
© 2026. The Author(s). Published by the American Astronomical Society.
Copyright ©
2026 Astronomy Image Explorer. All Rights Reserved.