Image Details
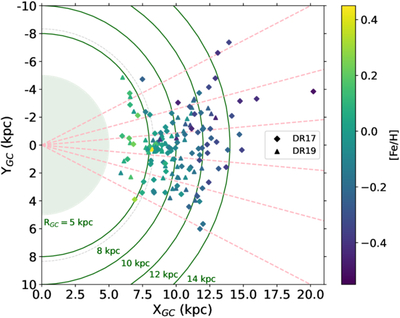
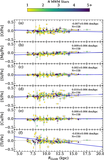
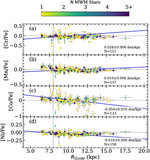
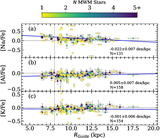
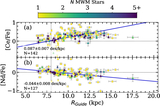
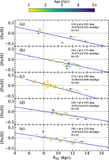
Caption: Figure 8.
Same plot as Figure 2, where the entire cluster sample is plotted in X–Y space, colored by the mean [Fe/H] abundance. The diamond points denote clusters that were in OCCAM DR17/N. Myers et al. (2022), while triangle points denote clusters new to this DR19 analysis. The solid green lines (RGC = 5, 8, 10, 12, 14 kpc) delineate the annuli used for analyzing azimuthal gradients (see Section 5.3 and Figure 10). The pink dashed lines indicate the boundaries of the azimuthal slices used for analyzing radial gradients (see Section 5.3 and Figure 9). The gray dashed line shows the solar Galactocentric radius used in this work (R⊙ = 8.34 kpc).
Other Images in This Article
Show More
Copyright and Terms & Conditions
© 2026. The Author(s). Published by the American Astronomical Society.