Image Details
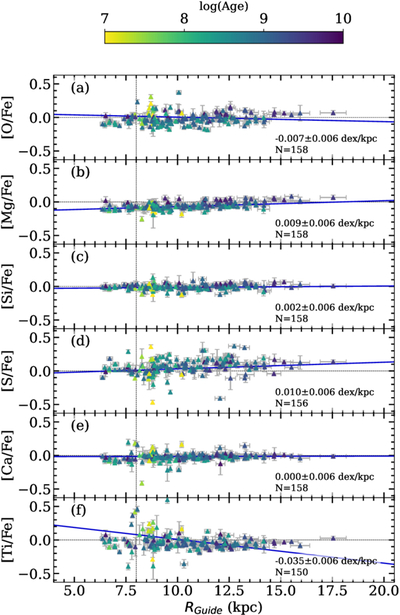
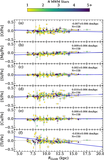
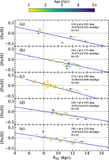
Caption: Figure 23.
The [X/Fe] vs. RGuide trend for the α-elements (O, Mg, Si, S, Ca, Ti). The color bar indicates the age of the cluster in log(Age) from T. Cantat-Gaudin et al. (2020). Clusters with a 1σ scatter greater than 0.2 dex for a specific element were not used to determine the fit (solid blue line) and are not plotted. The derived gradient and number of clusters (N) are shown in each panel.
Other Images in This Article
Show More
Copyright and Terms & Conditions
© 2026. The Author(s). Published by the American Astronomical Society.
Copyright ©
2026 Astronomy Image Explorer. All Rights Reserved.