Image Details
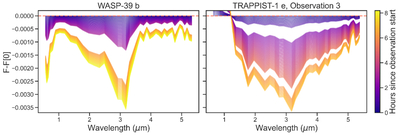
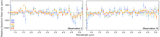
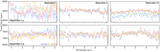
Caption: Figure 12.
Change in the out-of-transit linear slope as a function of time, shown as the change in the relative flux in reference to the beginning of the observation, for WASP-39 (left) and TRAPPIST-1, observation 3 (right). Each curve is colored by the time since the beginning of the observation, on the same scale. While parts of the change in the out-of-transit slope look similar, therefore likely pointing to an instrumental origin, TRAPPIST-1 e has a stronger change in out-of-transit linear slope across the shown wavelength range, likely due to the addition of a stellar component to the out-of-transit slope. Breaks in the curves are due to the masking of the transit events.
Other Images in This Article
Show More
Copyright and Terms & Conditions
© 2026. The Author(s). Published by the American Astronomical Society.