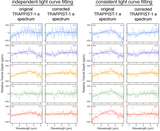
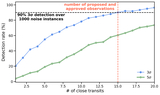
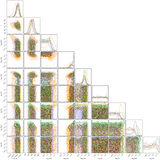
Image Details
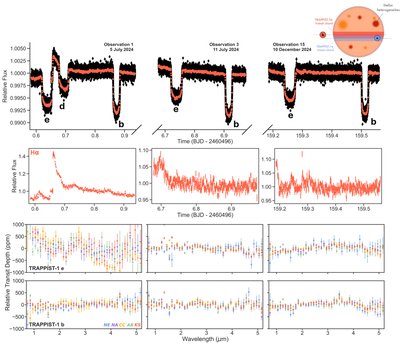
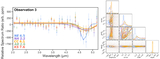
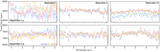
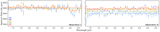
Caption: Figure 3.
Top: white light curves of observation 1, observation 3, and observation 15 from the N.A. reduction, both at native time resolution in black and binned to 25× in red for visibility. All transits are labeled by planet. Observation 1 also has a large flare that occurs right before the egress of planet e. Shown in the upper right is a schematic of our proposed setup, with the true overlapping planetary transit chords taken from E. Agol et al. (2021). Middle: Hα light curve from the N.A. reduction. Peaks in Hα correspond to flaring events, many of which are not visible in the white light curve, at least without hints to their location from the Hα signature. Note that the light curves are binned in time to 50× (to approximately 70 s bins) relative to that shown in the white light curve for visibility in the low signal single wavelengths shown. Bottom: transmission spectrum of TRAPPIST-1 e (top) and TRAPPIST-1 b (bottom) for observation 1, observation 3, and observation 15 from left to right.
Other Images in This Article
Show More
Copyright and Terms & Conditions
© 2026. The Author(s). Published by the American Astronomical Society.