Image Details
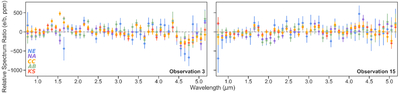
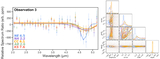
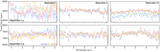
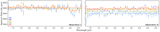
Caption: Figure 4.
Relative transmission spectrum ratio of TRAPPIST-1 e with TRAPPIST-1 b, for observation 3 (left) and observation 15 (right). The relative transmission spectrum ratio for observation 1 is not shown due to the large error bars in the TRAPPIST-1 e spectrum from this observation due to the large flare. The multiple reductions show close agreement for the most part, though differences in the estimated error bar sizes due to a combination of the number of free parameters, method of systematics removal, and included integrations for each reduction can be seen.
Other Images in This Article
Show More
Copyright and Terms & Conditions
© 2026. The Author(s). Published by the American Astronomical Society.
Copyright ©
2026 Astronomy Image Explorer. All Rights Reserved.