Image Details
Caption: Figure 3.
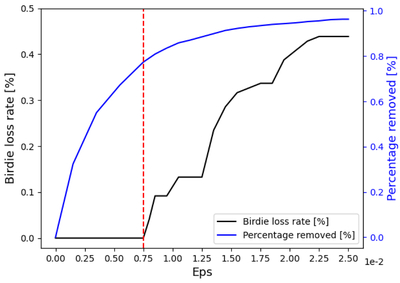
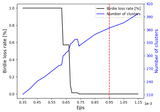
Optimization of the Eps parameter for the DBSCAN-based residual RFI removal. We set the MinPts parameter is 55. The black curve (left y-axis) shows the loss rate of simulated signals(“birdies”), while the blue curve (right y-axis) shows the percentage of total residual hits removed, both as a function of the Eps value. The red vertical line indicates the selected threshold of Eps = 7.5 × 10⁻³, which is the optimal point that removes the largest possible percentage of RFI while ensuring the birdie loss rate remains at zero.
Other Images in This Article
Copyright and Terms & Conditions
© 2026. The Author(s). Published by the American Astronomical Society.
Copyright ©
2026 Astronomy Image Explorer. All Rights Reserved.