Image Details
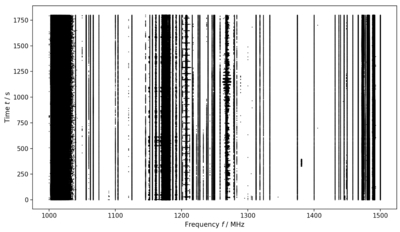
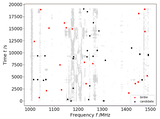
Caption: Figure 1.
The waterfall (frequency-time) plot of the raw observational data (i.e., hits, marked with black dots) from the first 1800 s of observation. The narrowband RFI is prominent, appearing as vertical lines; some broadband RFI (appearing as horizontal line segments) also exists. This figure is same as the Figure 1 in Y.-C. Wang et al. (2023).
Other Images in This Article
Copyright and Terms & Conditions
© 2026. The Author(s). Published by the American Astronomical Society.
Copyright ©
2026 Astronomy Image Explorer. All Rights Reserved.