Image Details
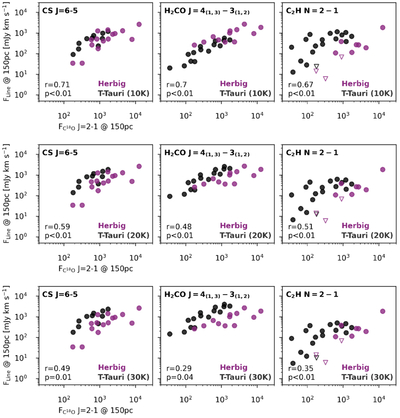
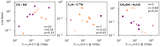
Caption: Figure 13.
Disk-integrated line fluxes normalized to 150 pc for the Herbig sample (purple) presented here and the T Tauri sample (black) compared to the C18O J–2–1 line flux. The T Tauri fluxes are scaled assuming a range of gas temperatures, where 20 K is likely the most realistic. Numbers in the bottom left of each panel show the resulting Pearson correlation coefficient (r) and p-value for each set of variables for all data points.
Other Images in This Article

Show More
Copyright and Terms & Conditions
© 2026. The Author(s). Published by the American Astronomical Society.
Copyright ©
2026 Astronomy Image Explorer. All Rights Reserved.