Image Details
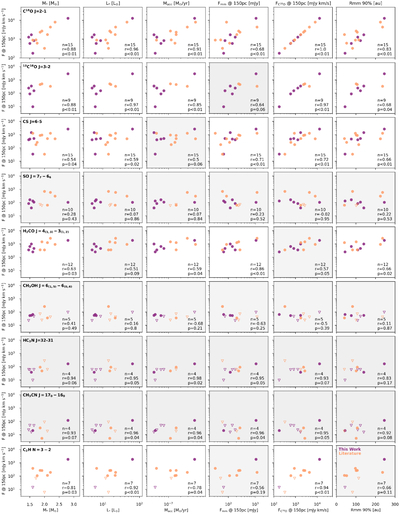
Caption: Figure 12.
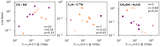
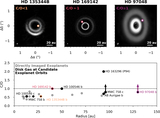
Disk-integrated line fluxes for Herbig disks normalized to 150 pc and compared to different bulk parameters of the systems. The purple points are the disks within this survey and the orange points are from the literature (see Table 6. The triangles denote 3σ upper limits. Numbers in the bottom right of each panel show the number of detections and the resulting Pearson correlation coefficient (r) and p-value for each set of variables, where panels with p > 0.05 are in gray as well as molecules with <5 detections.
Other Images in This Article

Show More
Copyright and Terms & Conditions
© 2026. The Author(s). Published by the American Astronomical Society.
Copyright ©
2026 Astronomy Image Explorer. All Rights Reserved.