Image Details
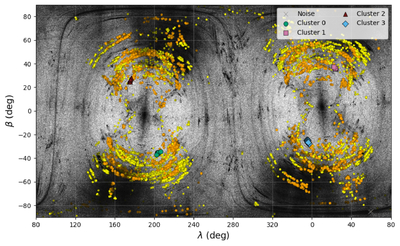
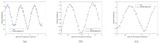
Caption: Figure 8.
Figure shows the distribution of pole orientation. We gridded the pole orientation space and performed parameter iteration at each grid point, and obtained the corresponding minimum chi-square values. Based on the chi-square ranking, yellow points represent the top 1% best-fitting solutions, and orange points correspond to the top 0.5%. The top 0.01% of solutions were further grouped into four clusters using a clustering algorithm, which are marked in the figure. As shown in the figure, the dispersion in the longitude distribution of the fitted pole solutions is larger than that in latitude, because at low orbital inclinations the longitude of the pole is difficult to distinguish from the initial rotational phase angle. The overall four-cluster distribution arises from the symmetry of the derived shape model.
Other Images in This Article

Show More
Copyright and Terms & Conditions
© 2026. The Author(s). Published by the American Astronomical Society.