Image Details
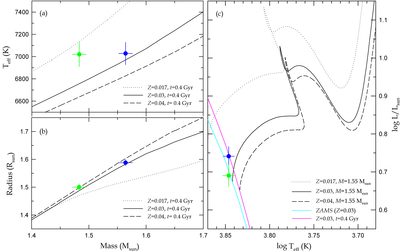
Caption: Figure 9.
Position of TIC 322208686 A (blue circle) and B (green circle) on the mass–temperature (a), mass–radius (b), and H–R (c) diagrams. In all panels, the dotted, solid, and dashed lines are the theoretic predictions with different metallicities of Z = 0.017, 0.03, and 0.04, respectively, from the PARSEC models (A. Bressan et al. 2012). In the right panel, the ZAMS and 0.4 Gyr isochrone for Z = 0.03 are presented as cyan and red solid lines, respectively.
Other Images in This Article
Copyright and Terms & Conditions
© 2025. The Author(s). Published by the American Astronomical Society.
Copyright ©
2025 Astronomy Image Explorer. All Rights Reserved.