Image Details
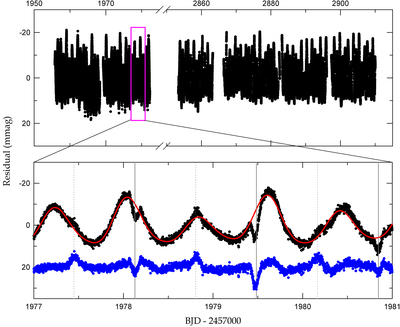
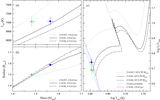
Caption: Figure 7.
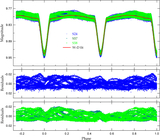
Light curve residuals from the W-D model fit to the TESS data. The lower panel is a zoomed-in view of the residuals shown in the inset box in the upper panel. The red solid line represents the synthetic curve computed from the 11 frequency fit to the out-of-eclipse data. The residuals from the frequency fit are offset from zero by +20 mmag for clarity and are plotted as the blue symbols. The vertical solid and dotted lines indicate the primary and secondary minimum epochs, respectively.
Other Images in This Article
Copyright and Terms & Conditions
© 2025. The Author(s). Published by the American Astronomical Society.
Copyright ©
2025 Astronomy Image Explorer. All Rights Reserved.