Image Details
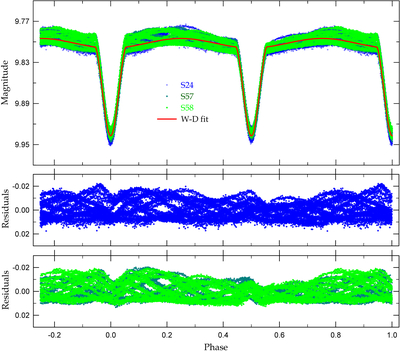
Caption: Figure 6.
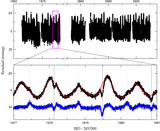
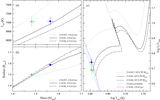
The top panel displays the phased light curve of TIC 322208686 with the fitted model. The blue, cyan, and green circles are the TESS measurements from Sectors 24, 57, and 58, respectively, and the red solid curve is computed with our W-D fit. The middle and bottom panels represent the corresponding residuals for 120 and 200 s cadence data, respectively, from the synthetic curve.
Other Images in This Article
Copyright and Terms & Conditions
© 2025. The Author(s). Published by the American Astronomical Society.
Copyright ©
2025 Astronomy Image Explorer. All Rights Reserved.