Image Details
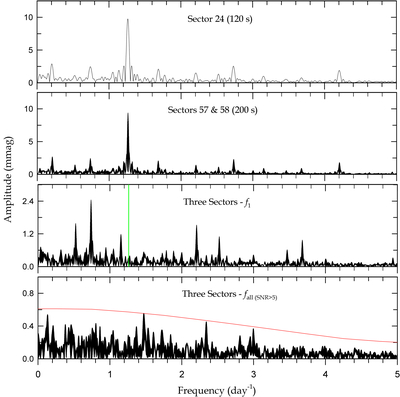
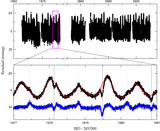
Caption: Figure 8.
PERIOD04 periodograms for the outside-eclipse TESS residuals. The first and second panels show the amplitude spectra of the 120 and 200 s residuals, respectively, while the third and bottom panels are obtained using the entire short-cadence data, prewhitening the most dominant frequency (f1) as indicated by a vertical green line and all 11 frequencies with SNR > 5, respectively. The red solid line in the bottom panel corresponds to five times the noise spectrum.
Other Images in This Article
Copyright and Terms & Conditions
© 2025. The Author(s). Published by the American Astronomical Society.
Copyright ©
2025 Astronomy Image Explorer. All Rights Reserved.