Image Details
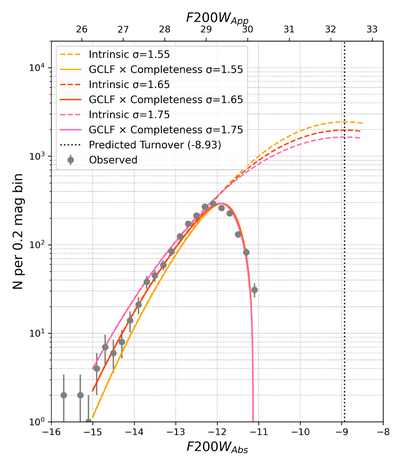
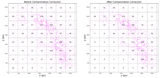
Caption: Figure 7.
K-corrected GCLF based on F200W photometry. Gray points show the observed number counts per 0.2 mag bin. Overlaid are intrinsic log-normal GCLF models (dashed lines) with σ = 1.55, 1.65, and 1.75, and their completeness-modified counterparts (solid lines) based on the best-fit detection function (Equation (1)). The model curves have been scaled to match the observed peak. The vertical dashed line marks the estimated turnover magnitude after k-correction, M0(Abs) = −8.93 mag, corresponding to m0(app) = 32.34 mag. The models illustrate that the observed distribution is consistent with an underlying turnover near this value, despite the lack of faint-end coverage in the data.
Other Images in This Article
Copyright and Terms & Conditions
© 2025. The Author(s). Published by the American Astronomical Society.