Image Details
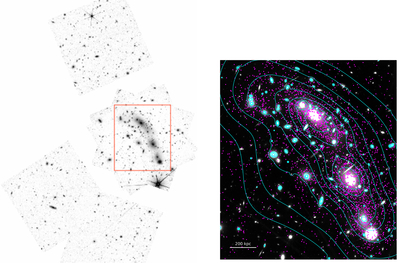
Caption: Figure 1.
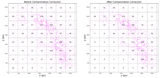
Left: the MACS0416 full mosaic field with north at the top and east to the left. The red box outlines the central cluster and the region used in this analysis. As described in the text, the outer region of the mosaic image with shorter total exposures and higher sky noise was not used, except for increasing our stellar PSF sample. Right: pink dots show the locations of the 2971 GC candidates for MACS0416 found in this study. Cyan contours show the projected mass density from the lensing model of J. M. Diego et al. (2024).
Other Images in This Article
Copyright and Terms & Conditions
© 2025. The Author(s). Published by the American Astronomical Society.
Copyright ©
2025 Astronomy Image Explorer. All Rights Reserved.