Image Details
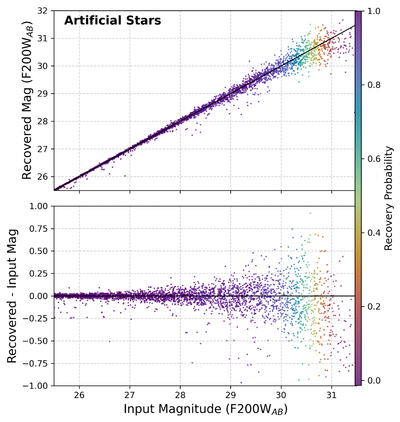
Caption: Figure 4.
Upper panel: measured recovery magnitude in F200W of the artificial stars versus input magnitude and color-coded by their recovery probability. The solid line shows the 1:1 relation. Lower panel: residuals (recovered–input magnitude) as a function of input magnitude. At brighter magnitudes, stars are accurately recovered, while systematic deviations and increased scatter appear at fainter magnitudes near the detection limit.
Other Images in This Article
Copyright and Terms & Conditions
© 2025. The Author(s). Published by the American Astronomical Society.
Copyright ©
2025 Astronomy Image Explorer. All Rights Reserved.