Image Details
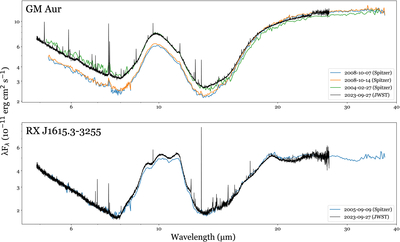
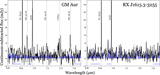
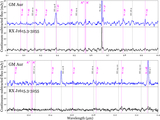
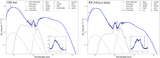
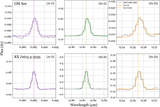
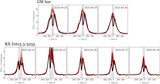
Caption: Figure 9.
JWST-MIRI MRS spectra (black lines) of GM Aur and J1615 plotted alongside their respective archival Spitzer spectra (colored lines). GM Aur shows continuum variability in the shorter wavelengths, while J1615’s continuum level is consistent between Spitzer and JWST observations.
Other Images in This Article
Show More
Copyright and Terms & Conditions
© 2025. The Author(s). Published by the American Astronomical Society.
Copyright ©
2026 Astronomy Image Explorer. All Rights Reserved.