Image Details
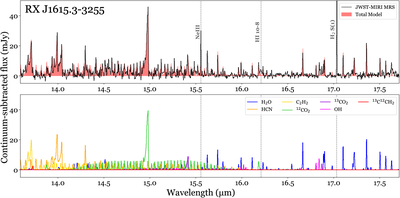
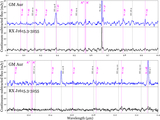
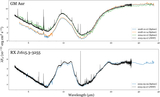
Caption: Figure 3.
The 13.6–17.7 μm wavelength range of the J1615 spectrum. The continuum-subtracted JWST-MIRI data (black, top panel) is overlaid with the total modeled emission (red, top panel) from the component molecules (bottom panel): H2O (blue), HCN (orange), C2H2 (yellow), 12CO2 (green), 13CO2 (purple), OH (pink), 13C12CH2 (red). Based on our detection criteria (see Section 3.1), we consider all fitted species positive detections. The detected bright H I, H2, and atomic emission lines are labeled with dashed lines.
Other Images in This Article
Show More
Copyright and Terms & Conditions
© 2025. The Author(s). Published by the American Astronomical Society.
Copyright ©
2026 Astronomy Image Explorer. All Rights Reserved.