Image Details
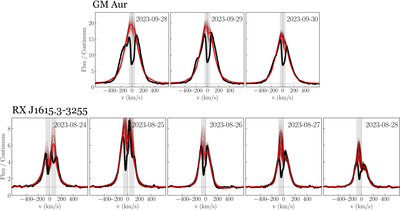
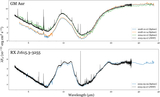
Caption: Figure 8.
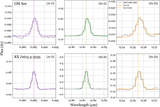
Accretion flow model fits (red) to the Chiron Hα observations (black) surrounding the JWST observations of J1615 (top row) and GM Aur (bottom row). The low-opacity maroon lines show the 200 best-fit models from which the parameter medians and standard deviations are determined (presented in Table 7). Absorption that is not taken into account by the flow model is masked out, indicated by the gray shaded regions.
Other Images in This Article
Show More
Copyright and Terms & Conditions
© 2025. The Author(s). Published by the American Astronomical Society.
Copyright ©
2026 Astronomy Image Explorer. All Rights Reserved.