Image Details
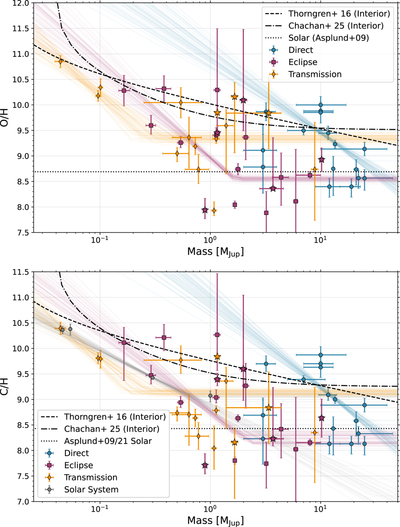
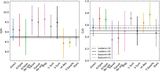
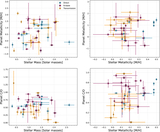
Caption: Figure 6.
O/H (top) and C/H (bottom) in ﹩{\mathrm{log}}_{10}﹩ parts per trillion as a function of mass. Planets observed with direct spectroscopy are shown as blue circles, planets observed with eclipse spectroscopy as magenta squares, and planets observed with transit spectroscopy as gold diamonds. The solar system gas planets are shown in gray, and ultrahot Jupiters are labeled as stars. A total of 50 samples from the fit using Equation (5) are shown for reference. The dotted line shows the bulk metallicity vs. mass trend inferred from interior models (D. P. Thorngren et al. 2016; Y. Chachan et al. 2025) converted to number density via Equation (2) of D. Thorngren & J. J. Fortney (2019).
Other Images in This Article

Copyright and Terms & Conditions
© 2025. The Author(s). Published by the American Astronomical Society.