Image Details
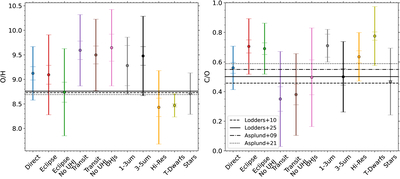
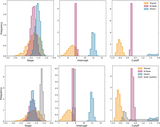
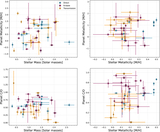
Caption: Figure 4.
Median values of the O/H (left; ﹩{\mathrm{log}}_{10}﹩ parts per trillion) and C/O (right) shown for different subsamples. The outermost error bar shows the standard deviation of measurements from that sample, while the inner error bar represents the standard deviation of the mean for reference. Also plotted as horizontal black lines are O/H and C/O values from different stellar abundance definitions.
Other Images in This Article

Copyright and Terms & Conditions
© 2025. The Author(s). Published by the American Astronomical Society.
Copyright ©
2025 Astronomy Image Explorer. All Rights Reserved.