Image Details
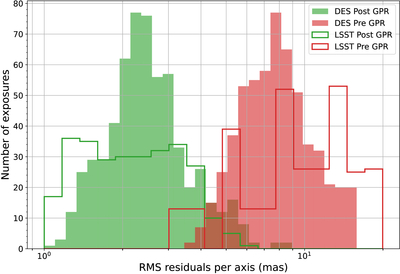
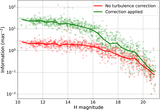
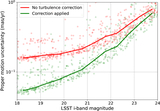
Caption: Figure 2.
Distribution of rms astrometric residuals per axis on all 604 DES exposures (filled) and LSST simulations (step) under similar conditions. Red denotes the rms computed from the original correlation function of the displacements (pre-GPR); and green, the equivalent value obtained after subtraction of the GPR model (post-GPR).
Other Images in This Article
Copyright and Terms & Conditions
© 2025. The Author(s). Published by the American Astronomical Society.
Copyright ©
2026 Astronomy Image Explorer. All Rights Reserved.